For my Data Storytelling project in Dr. Brinnae Bent’s AIPI 510 class, Michael Saju and I wanted to dig into the conversations around data centers and the power grid. There’s been a lot of buzz about whether data centers are putting too much strain on our energy systems, so we thought it would be interesting to explore the actual data and see what kind of story it might tell.
Data centers may not cause as much of a strain on the power grid as you might think, at least based on what we’ve seen so far. In our class project, we took a look at the power grid data to include Net Generation (MWh), Demand (MWh), and Total Interchange from July 2024 to July 2025 from the EIA to conduct an Exploratory Data Analysis.
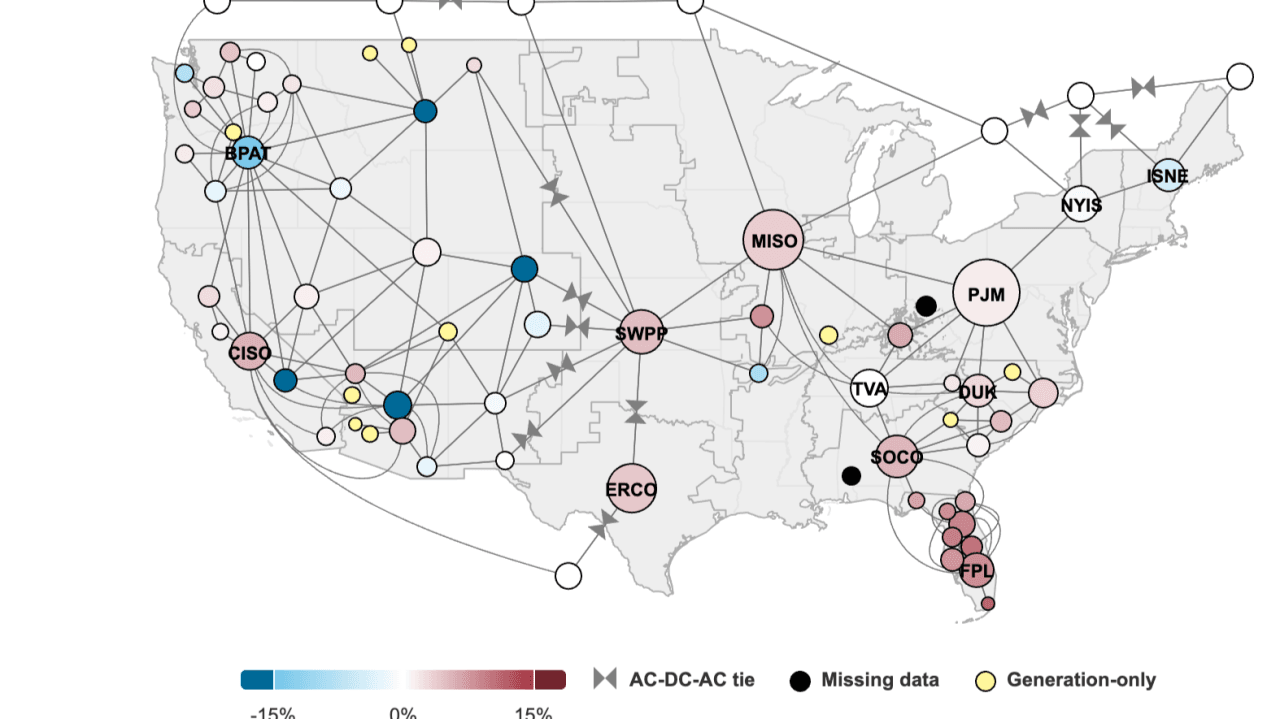
If we take a look at Virginia, it has the most data centers in the U.S. Yet, interestingly, there doesn’t appear to be strain on the grid in Virginia itself. Why is that? The balancing authority for Virginia (known as PJM Interconnection, LLC) seems able to supply their own power. But how is PJM able to supply their own power to themselves and still serve other BA’s? If we take a look at the map below:
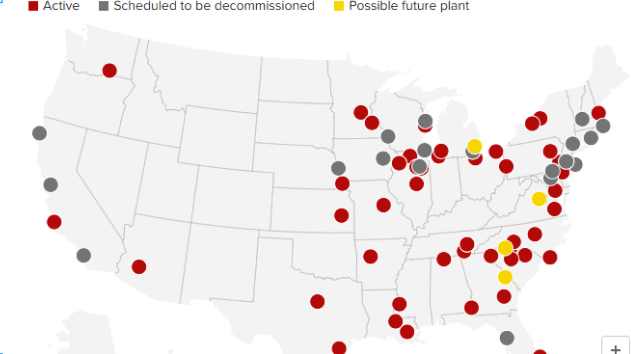
We notice that there are a lot of nuclear power plants nearby the Virginia region. Could this be one of the reasons Virginia is able to consume large amounts of power and still meet demand? It seems that the balancing authority for Virginia is not only meeting demand, but producing so much energy that they are able to give it to other balancing authorities:
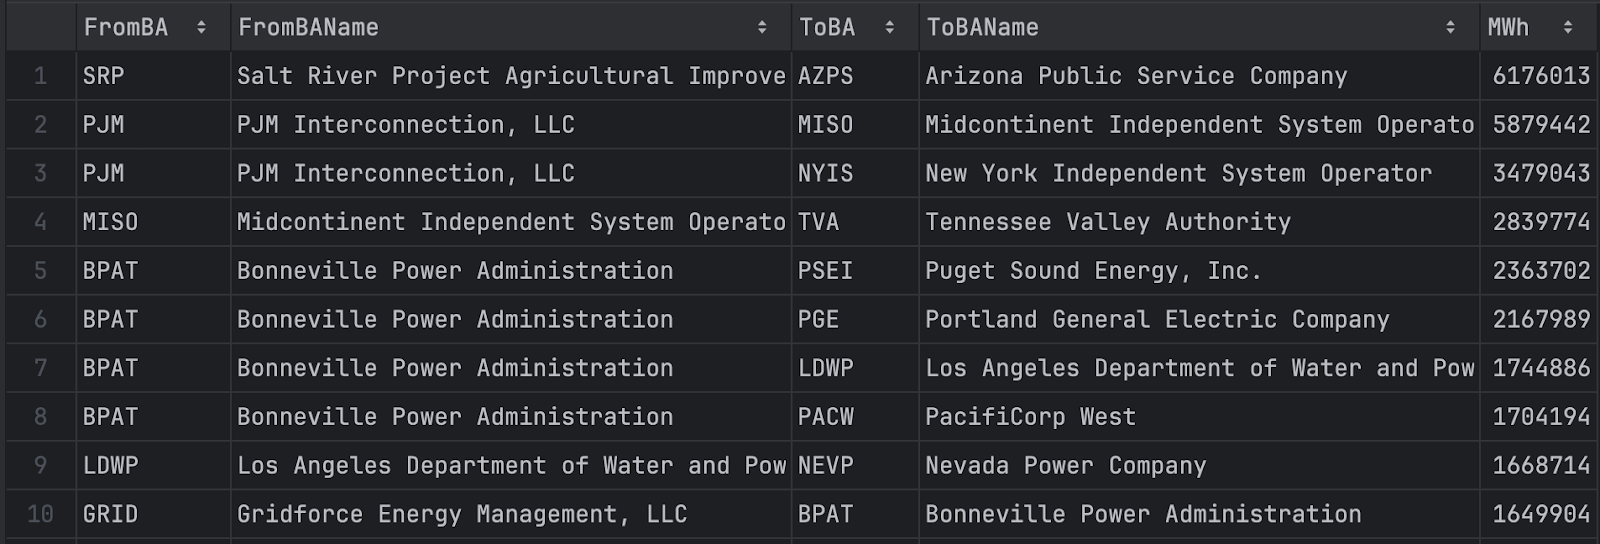
They lend MISO and the NYISO massive amounts of energy. While this is just for the NW Region, all the graphs looked just like this. Meaning, there are no balancing authorities that are not able to meet the demand, especially without the help of other balancing authorities as shown below:
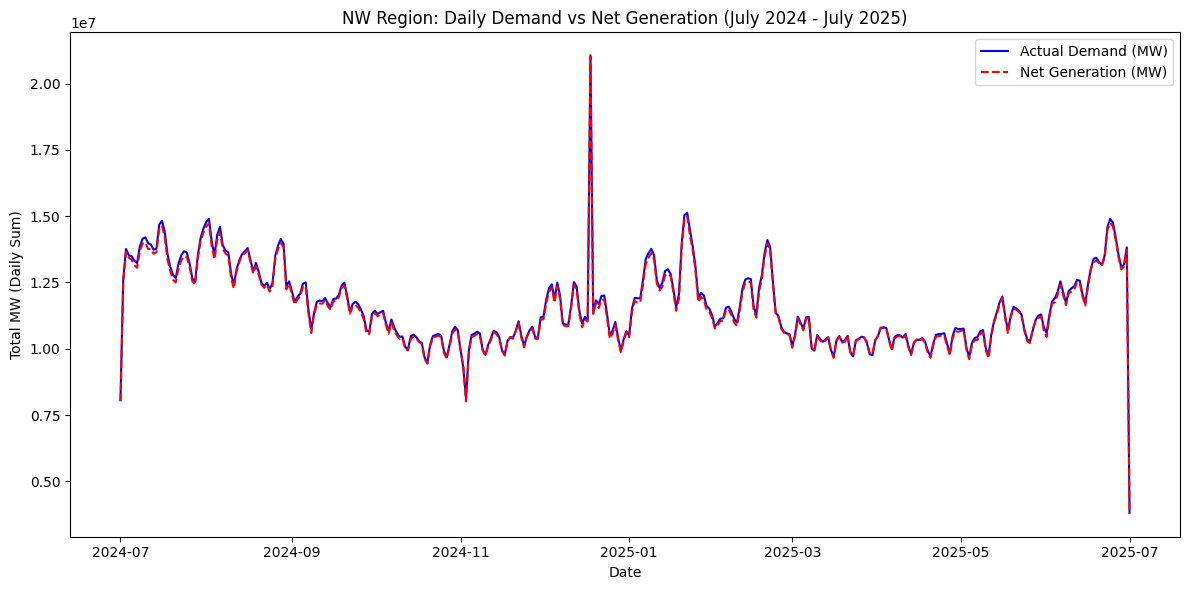
The Net Generation is always pretty close to the actual demand. But what does that really tell us? Perhaps the takeaway is that, while there may have been concerns about the strain on the power grid in the future, there are already steps being taken (and possibly more that could be taken) to prevent that outcome. Could this reflect something larger about the power of Americans to be proactive? While the risks are real if nothing were done, the picture now seems to suggest that the issue isn’t as pressing as some might fear. Especially with states like Virginia, there are examples of success worth thinking about.
Still, there are limitations and assumptions to keep in mind. First, this data is not from this month, so conditions could have shifted since September. Next, nuclear power clearly provides a lot of energy, but we are assuming that it plays a key role in PJM’s ability to contribute to other balancing authorities. Is that assumption correct, or could there be other factors? Regardless, the graph above shows that supply is currently able to meet demand.
So what do we make of this? Maybe it’s safe to say that right now, the strain on the energy grid is not significant enough to cripple our infrastructure. But should we take this as a sign of long term security, or just a temporary stability that depends on vigilance and planning? What if demand spikes even further, or certain sources of supply falter? These are the questions worth asking as we continue to trace the currents.